Institutional Volume Profile# Institutional Volume Profile (IVP) - Advanced Volume Analysis Indicator
## Overview
The Institutional Volume Profile (IVP) is a sophisticated technical analysis tool that combines traditional volume profile analysis with institutional volume detection algorithms. This indicator helps traders identify key price levels where significant institutional activity has occurred, providing insights into market structure and potential support/resistance zones.
## Key Features
### 🎯 Volume Profile Analysis
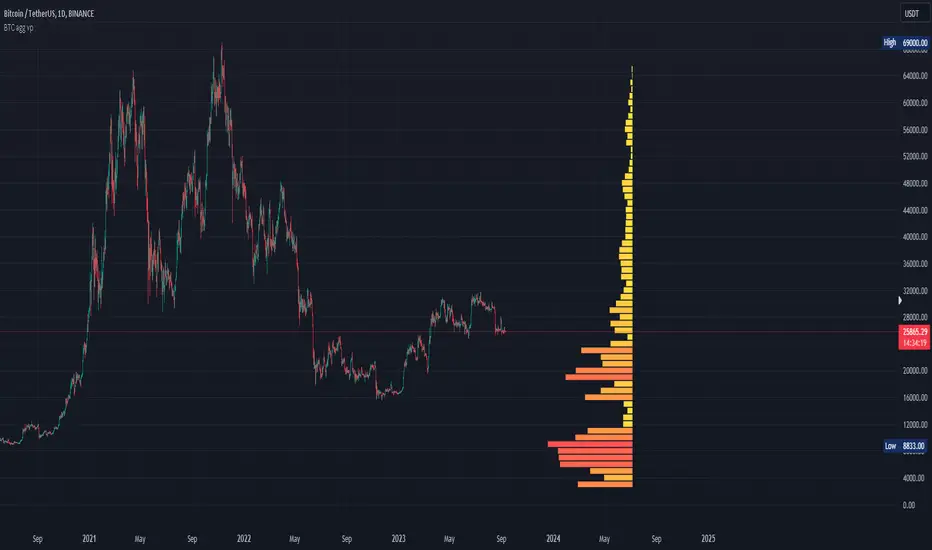
- **Point of Control (POC)**: Identifies the price level with the highest volume activity
- **Value Area**: Highlights the price range containing a specified percentage (default 70%) of total volume
- **Multi-Row Distribution**: Displays volume distribution across 10-50 price levels for detailed analysis
- **Customizable Period**: Analyze volume profiles over 10-500 bars
### 🏛️ Institutional Volume Detection
- **Pocket Pivot Volume (PPV)**: Detects bullish institutional buying when up-volume exceeds recent down-volume peaks
- **Pivot Negative Volume (PNV)**: Identifies bearish institutional selling when down-volume exceeds recent up-volume peaks
- **Accumulation Detection**: Spots potential accumulation phases with high volume and narrow price ranges
- **Distribution Analysis**: Identifies distribution patterns with high volume but minimal price movement
### 🎨 Visual Customization Options
- **Multiple Color Schemes**: Heat Map, Institutional, Monochrome, and Rainbow themes
- **Bar Styles**: Solid, Gradient, Outlined, and 3D Effect rendering
- **Volume Intensity Display**: Visual intensity based on volume magnitude
- **Flexible Positioning**: Left or right side profile placement
- **Current Price Highlighting**: Real-time price level indication
### 📊 Advanced Visual Features
- **Volume Labels**: Display volume amounts at key price levels
- **Gradient Effects**: Multi-step gradient rendering for enhanced visibility
- **3D Styling**: Shadow effects for professional appearance
- **Opacity Control**: Adjustable transparency (10-100%)
- **Border Customization**: Configurable border width and styling
## How It Works
### Volume Distribution Algorithm
The indicator analyzes each bar within the specified period and distributes its volume proportionally across the price levels it touches. This creates an accurate representation of where trading activity has been concentrated.
### Institutional Detection Logic
- **PPV Trigger**: Current up-bar volume > highest down-volume in lookback period + above volume MA
- **PNV Trigger**: Current down-bar volume > highest up-volume in lookback period + above volume MA
- **Accumulation**: High volume + narrow range + bullish close
- **Distribution**: Very high volume + minimal price movement
### Value Area Calculation
Starting from the POC, the algorithm expands both upward and downward, adding volume until reaching the specified percentage of total volume (default 70%).
## Configuration Parameters
### Profile Settings
- **Profile Period**: 10-500 bars (default: 50)
- **Number of Rows**: 10-50 levels (default: 24)
- **Profile Width**: 10-100% of screen (default: 30%)
- **Value Area %**: 50-90% (default: 70%)
### Institutional Analysis
- **PPV Lookback Days**: 5-20 periods (default: 10)
- **Volume MA Length**: 10-200 periods (default: 50)
- **Institutional Threshold**: 1.0-2.0x multiplier (default: 1.2)
### Visual Controls
- **Bar Style**: Solid, Gradient, Outlined, 3D Effect
- **Color Scheme**: Heat Map, Institutional, Monochrome, Rainbow
- **Profile Position**: Left or Right side
- **Opacity**: 10-100%
- **Show Labels**: Volume amount display toggle
## Interpretation Guide
### Volume Profile Elements
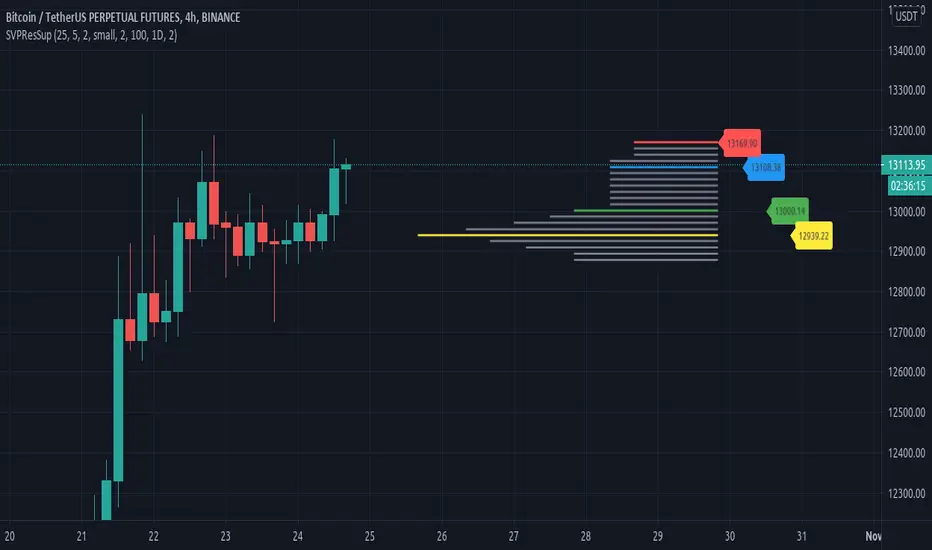
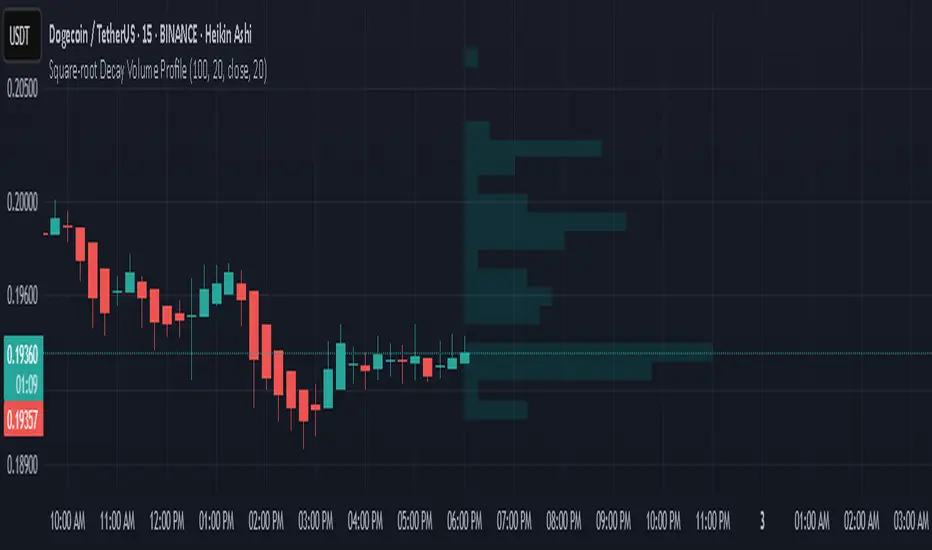
- **Thick Horizontal Bars**: High volume nodes (strong support/resistance)
- **Thin Horizontal Bars**: Low volume nodes (weak levels)
- **White Line (POC)**: Strongest support/resistance level
- **Blue Highlighted Area**: Value Area (fair value zone)
### Institutional Signals
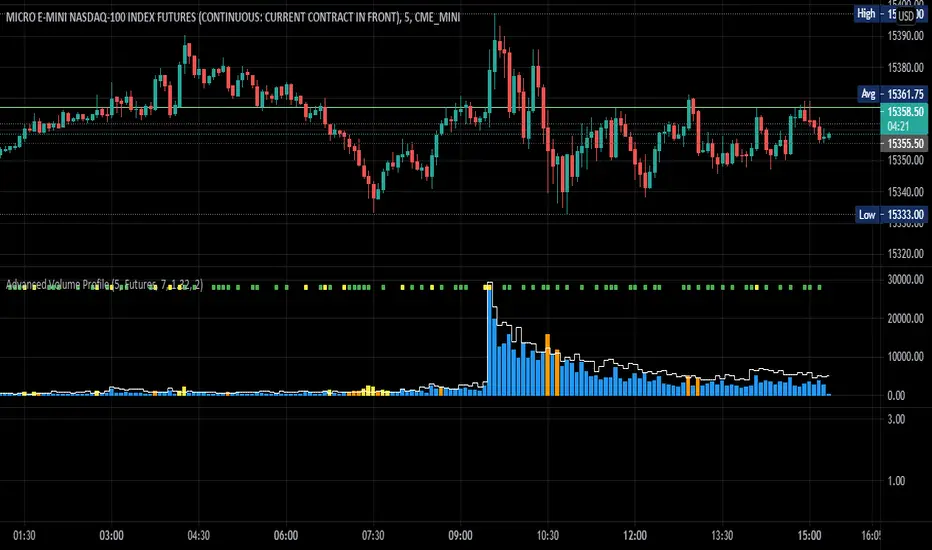
- **Blue Triangles (PPV)**: Bullish institutional buying detected
- **Orange Triangles (PNV)**: Bearish institutional selling detected
- **Color-Coded Bars**: Different colors indicate institutional activity types
### Color Scheme Meanings
- **Heat Map**: Red (high volume) → Orange → Yellow → Gray (low volume)
- **Institutional**: Blue (PPV), Orange (PNV), Aqua (Accumulation), Yellow (Distribution)
- **Monochrome**: Grayscale intensity based on volume
- **Rainbow**: Color-coded by price level position
## Trading Applications
### Support and Resistance
- POC acts as dynamic support/resistance
- High volume nodes indicate strong price levels
- Low volume areas suggest potential breakout zones
### Institutional Activity
- PPV above Value Area: Strong bullish signal
- PNV below Value Area: Strong bearish signal
- Accumulation patterns: Potential upward breakouts
- Distribution patterns: Potential downward pressure
### Market Structure Analysis
- Value Area defines fair value range
- Profile shape indicates market sentiment
- Volume gaps suggest potential price targets
## Alert Conditions
- PPV Detection at current price level
- PNV Detection at current price level
- PPV above Value Area (strong bullish)
- PNV below Value Area (strong bearish)
## Best Practices
1. Use multiple timeframes for confirmation
2. Combine with price action analysis
3. Pay attention to volume context (above/below average)
4. Monitor institutional signals near key levels
5. Consider overall market conditions
## Technical Notes
- Maximum 500 boxes and 100 labels for optimal performance
- Real-time calculations update on each bar close
- Historical analysis uses complete bar data
- Compatible with all TradingView chart types and timeframes
---
*This indicator is designed for educational and informational purposes. Always combine with other analysis methods and risk management strategies.*
אינדיקטור Pine Script®